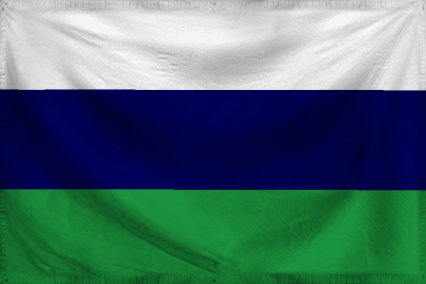
The Republic of The celt-slav union
?r r?abhl?id!
Region: Arctica
Quicksearch Query: The celt-slav union
|
Quicksearch: | |
NS Economy Mobile Home |
Regions Search |
The celt-slav union NS Page |
|
| GDP Leaders | Export Leaders | Interesting Places BIG Populations | Most Worked | | Militaristic States | Police States | |

?r r?abhl?id!
Region: Arctica
Quicksearch Query: The celt-slav union
| The celt-slav union Domestic Statistics | |||
|---|---|---|---|
| Government Category: | Republic | ||
| Government Priority: | Defence | ||
| Economic Rating: | All-Consuming | ||
| Civil Rights Rating: | Rare | ||
| Political Freedoms: | Rare | ||
| Income Tax Rate: | 17% | ||
| Consumer Confidence Rate: | 97% | ||
| Worker Enthusiasm Rate: | 97% | ||
| Major Industry: | Arms Manufacturing | ||
| National Animal: | elk | ||
| The celt-slav union Demographics | |||
| Total Population: | 846,000,000 | ||
| Criminals: | 90,021,085 | ||
| Elderly, Disabled, & Retirees: | 115,633,870 | ||
| Military & Reserves: ? | 65,385,618 | ||
| Students and Youth: | 138,236,400 | ||
| Unemployed but Able: | 126,329,233 | ||
| Working Class: | 310,393,794 | ||
| The celt-slav union Government Budget Details | |||
| Government Budget: | $6,263,428,007,854.08 | ||
| Government Expenditures: | $5,637,085,207,068.67 | ||
| Goverment Waste: | $626,342,800,785.41 | ||
| Goverment Efficiency: | 90% | ||
| The celt-slav union Government Spending Breakdown: | |||
| Administration: | $676,450,224,848.24 | 12% | |
| Social Welfare: | $0.00 | 0% | |
| Healthcare: | $676,450,224,848.24 | 12% | |
| Education: | $225,483,408,282.75 | 4% | |
| Religion & Spirituality: | $0.00 | 0% | |
| Defense: | $1,634,754,710,049.91 | 29% | |
| Law & Order: | $1,071,046,189,343.05 | 19% | |
| Commerce: | $1,014,675,337,272.36 | 18% | |
| Public Transport: | $394,595,964,494.81 | 7% | |
| The Environment: | $0.00 | 0% | |
| Social Equality: | $0.00 | 0% | |
| The celt-slav unionWhite Market Economic Statistics ? | |||
| Gross Domestic Product: | $4,580,520,000,000.00 | ||
| GDP Per Capita: | $5,414.33 | ||
| Average Salary Per Employee: | $9,025.24 | ||
| Unemployment Rate: | 20.68% | ||
| Consumption: | $19,832,695,265,689.60 | ||
| Exports: | $3,038,084,595,712.00 | ||
| Imports: | $3,282,225,594,368.00 | ||
| Trade Net: | -244,140,998,656.00 | ||
| The celt-slav union Non Market Statistics ? Evasion, Black Market, Barter & Crime | |||
| Black & Grey Markets Combined: | $13,499,252,929,966.25 | ||
| Avg Annual Criminal's Income / Savings: ? | $15,239.49 | ||
| Recovered Product + Fines & Fees: | $1,923,643,542,520.19 | ||
| Black Market & Non Monetary Trade: | |||
| Guns & Weapons: | $956,724,115,872.42 | ||
| Drugs and Pharmaceuticals: | $461,866,814,559.10 | ||
| Extortion & Blackmail: | $989,714,602,626.64 | ||
| Counterfeit Goods: | $1,699,010,067,842.40 | ||
| Trafficking & Intl Sales: | $230,933,407,279.55 | ||
| Theft & Disappearance: | $395,885,841,050.66 | ||
| Counterfeit Currency & Instruments : | $1,501,067,147,317.07 | ||
| Illegal Mining, Logging, and Hunting : | $115,466,703,639.77 | ||
| Basic Necessitites : | $65,980,973,508.44 | ||
| School Loan Fraud : | $131,961,947,016.89 | ||
| Tax Evasion + Barter Trade : | $5,804,678,759,885.49 | ||
| The celt-slav union Total Market Statistics ? | |||
| National Currency: | Euro | ||
| Exchange Rates: | 1 Euro = $0.63 | ||
| $1 = 1.58 Euros | |||
| Regional Exchange Rates | |||
| Gross Domestic Product: | $4,580,520,000,000.00 - 25% | ||
| Black & Grey Markets Combined: | $13,499,252,929,966.25 - 75% | ||
| Real Total Economy: | $18,079,772,929,966.25 | ||
| Arctica Economic Statistics & Links | |||
| Gross Regional Product: | $2,988,519,580,499,968 | ||
| Region Wide Imports: | $379,972,636,114,944 | ||
| Largest Regional GDP: | Soviet Union CCCP | ||
| Largest Regional Importer: | Soviet Union CCCP | ||
| Regional Search Functions: | All Arctica Nations. | ||
| Regional Nations by GDP | Regional Trading Leaders | |||
| Regional Exchange Rates | WA Members | |||
| Returns to standard Version: | FAQ | About | About | 483,719,585 uses since September 1, 2011. | |
Version 3.69 HTML4. V 0.7 is HTML1. |
Like our Calculator? Tell your friends for us... |